Frontiers of Data and Computing ›› 2026, Vol. 8 ›› Issue (1): 45-63.
CSTR: 32002.14.jfdc.CN10-1649/TP.2026.01.005
doi: 10.11871/jfdc.issn.2096-742X.2026.01.005
• Special Issue: Computational Finance • Previous Articles Next Articles
FENG Wenjun1( ),ZHANG Zhengjun2,3,4,*(),WANG Yiming5
Received:2025-03-20
Online:2026-02-20
Published:2026-02-02
Contact:
ZHANG Zhengjun
E-mail:fengwj@bjtu.edu.cn.;zjz@stat.wisc.edu
FENG Wenjun,ZHANG Zhengjun,WANG Yiming. Jump Information, Machine Learning Models, and Realized Volatility Forecasting[J]. Frontiers of Data and Computing, 2026, 8(1): 45-63, https://cstr.cn/32002.14.jfdc.CN10-1649/TP.2026.01.005.
Table 1
Descriptive statistics"
| 均值 | 0.1504 | 0.0942 | 0.0562 | 1.2032 | 0.0018 | 0.0002 |
| 标准差 | 0.2392 | 0.1336 | 0.1541 | 0.3667 | 0.0036 | 0.0002 |
| 偏度 | 6.0572 | 6.7248 | 8.6674 | 4.6229 | 1.0929 | 3.2598 |
| 峰度 | 65.8597 | 118.5584 | 111.8555 | 65.7323 | 4.2289 | 18.6625 |
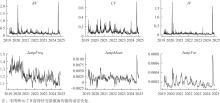
Fig.1
Dynamic changes in the cross-sectional mean of feature variables"

Table 2
Correlation of daily features"
| 1.0000 | 0.8033 | 0.8564 | -0.0551 | 0.2990 | 0.4687 | |
| 0.8033 | 1.0000 | 0.3805 | -0.0791 | 0.3347 | 0.5220 | |
| 0.8564 | 0.3805 | 1.0000 | -0.0169 | 0.1742 | 0.2753 | |
| -0.0551 | -0.0791 | -0.0169 | 1.0000 | -0.0590 | -0.1377 | |
| 0.2990 | 0.3347 | 0.1742 | -0.0590 | 1.0000 | 0.2956 | |
| 0.4687 | 0.5220 | 0.2753 | -0.1377 | 0.2956 | 1.0000 |
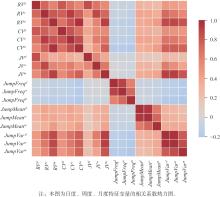
Fig.2
Heatmap of feature variable correlations"
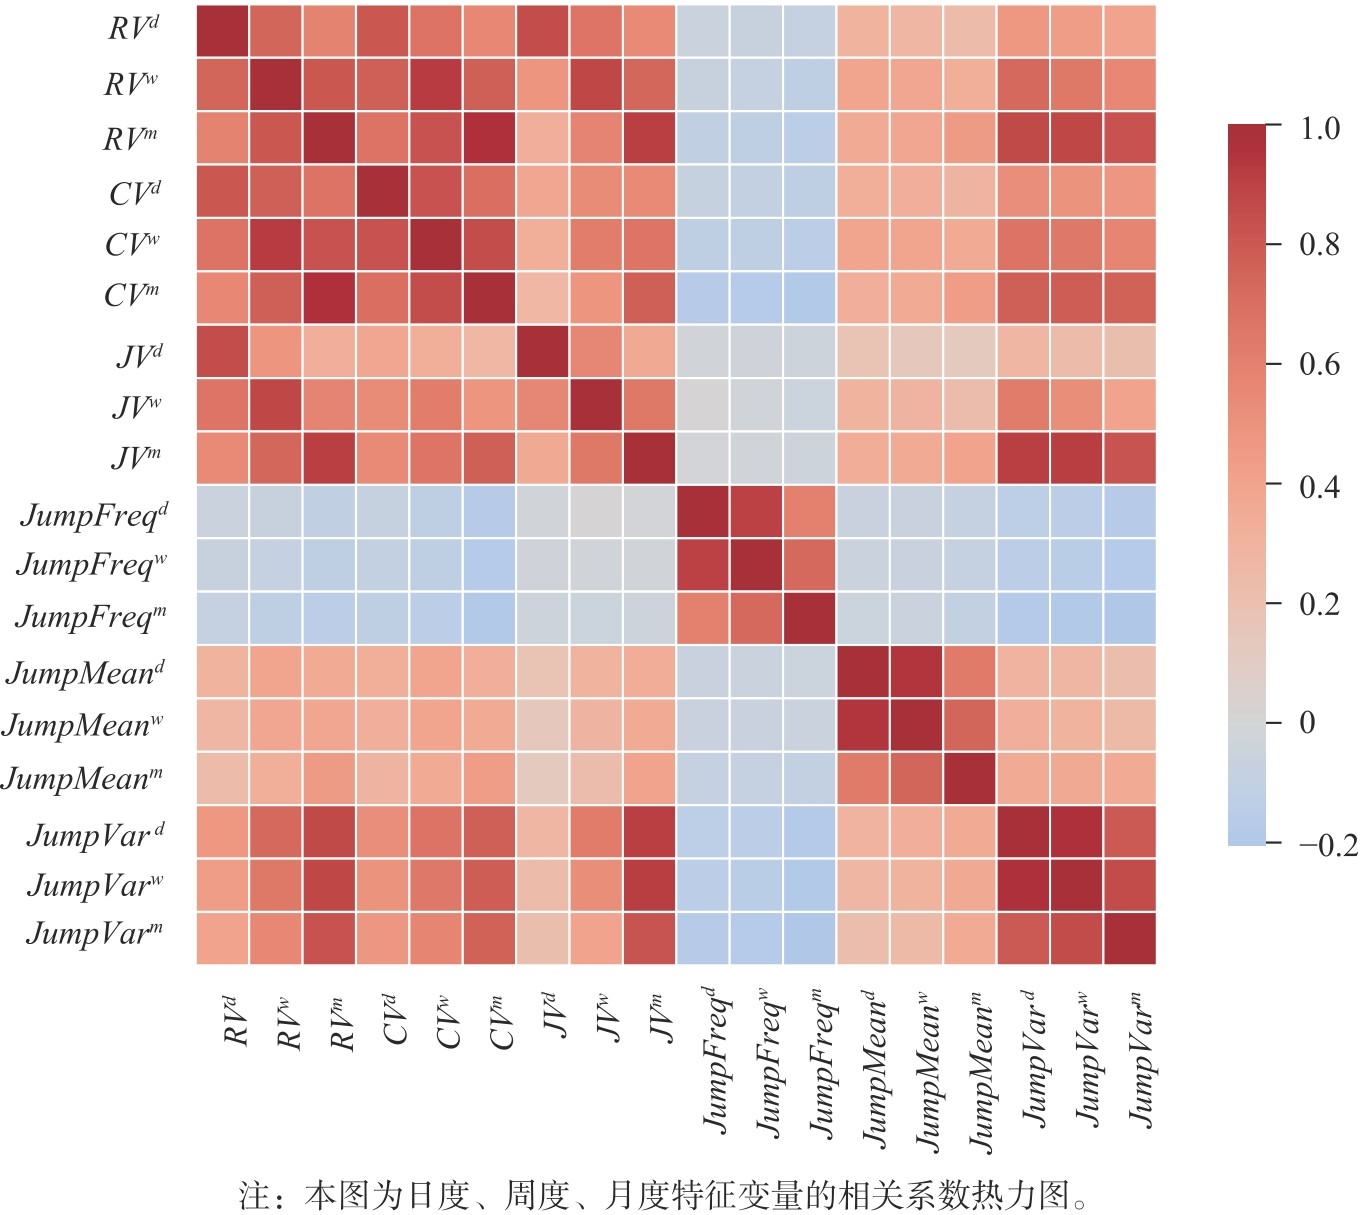
Table 3
HAR model regression results"
| 特征集1 | 特征集2 | 特征集3 | |||||||||||||
|---|---|---|---|---|---|---|---|---|---|---|---|---|---|---|---|
| 日度 | 周度 | 月度 | 日度 | 周度 | 月度 | 日度 | 周度 | 月度 | |||||||
| 0.2734 | 0.1525 | 0.0713 | |||||||||||||
| (78.6610) | (63.4492) | (35.0318) | |||||||||||||
| 0.2923 | 0.2508 | 0.1587 | |||||||||||||
| (47.8187) | (59.2061) | (44.2755) | |||||||||||||
| 0.3045 | 0.3980 | 0.4490 | |||||||||||||
| (50.8216) | (96.0699) | (127.1862) | |||||||||||||
| 0.4336 | 0.2857 | 0.1592 | 0.5141 | 0.3260 | 0.1717 | ||||||||||
| (58.0161) | (55.9997) | (36.8528) | (67.7052) | (63.6538) | (40.0368) | ||||||||||
| 0.4541 | 0.4659 | 0.3306 | 0.4968 | 0.4781 | 0.3495 | ||||||||||
| (35.4831) | (53.4516) | (44.9044) | (37.4969) | (53.6447) | (46.9145) | ||||||||||
| 0.2459 | 0.3664 | 0.5105 | 0.1857 | 0.3366 | 0.4824 | ||||||||||
| (18.8515) | (41.3923) | (68.2617) | (13.0054) | (35.1333) | (60.2734) | ||||||||||
| 0.2167 | 0.1076 | 0.0418 | |||||||||||||
| (49.9777) | (36.5844) | (16.9186) | |||||||||||||
| 0.0851 | 0.0146 | -0.0141 | |||||||||||||
| (8.5830) | (2.1656) | (-2.5003) | |||||||||||||
| 0.1250 | 0.1453 | 0.1080 | |||||||||||||
| (7.6911) | (13.2157) | (11.5782) | |||||||||||||
| 0.0143 | 0.0066 | 0.0016 | |||||||||||||
| (13.1505) | (9.0509) | (2.7059) | |||||||||||||
| -0.0143 | -0.0075 | -0.0030 | |||||||||||||
| (-11.4261) | (-9.0194) | (-4.2963) | |||||||||||||
| 0.0068 | 0.0062 | 0.0046 | |||||||||||||
| (13.6450) | (18.6392) | (16.4187) | |||||||||||||
| 0.0184 | 0.0275 | 0.0431 | 0.0183 | 0.0274 | 0.0431 | 0.0199 | 0.0271 | 0.0420 | |||||||
| (25.2712) | (54.4080) | (99.4040) | (25.4306) | (55.9343) | (103.2671) | (26.7838) | (54.3054) | (99.7796) | |||||||
| 特征集4 | 特征集5 | 特征集6 | |||||||||||||
| 日度 | 周度 | 月度 | 日度 | 日度 | 周度 | 日度 | 周度 | 月度 | |||||||
| 0.4272 | 0.2856 | 0.1592 | 0.5034 | 0.3197 | 0.1682 | 0.4175 | 0.2775 | 0.1523 | |||||||
| (56.3962) | (55.4185) | (36.6144) | (66.0931) | (62.2559) | (39.1062) | (54.8244) | (53.6412) | (34.9005) | |||||||
| 0.4522 | 0.4501 | 0.3321 | 0.4705 | 0.4525 | 0.3298 | 0.4502 | 0.4495 | 0.3336 | |||||||
| (34.7662) | (50.9433) | (44.6581) | (34.9462) | (50.0077) | (43.5800) | (33.4197) | (49.2446) | (43.4262) | |||||||
| 0.2506 | 0.3777 | 0.5028 | 0.2089 | 0.3577 | 0.5010 | 0.2465 | 0.3676 | 0.4978 | |||||||
| (18.6824) | (41.5738) | (65.7440) | (14.2549) | (36.4172) | (60.9695) | (16.8316) | (37.1693) | (59.8158) | |||||||
| 0.2167 | 0.1077 | 0.0412 | 0.2195 | 0.1094 | 0.0401 | ||||||||||
| (49.5984) | (36.4575) | (16.7035) | (46.5816) | (34.3912) | (15.0598) | ||||||||||
| 0.0820 | 0.0128 | -0.0183 | 0.0445 | -0.0119 | -0.0314 | ||||||||||
| (8.1884) | (1.8895) | (-3.2349) | (3.2625) | (-1.2940) | (-4.0535) | ||||||||||
| 0.1254 | 0.1460 | 0.1162 | 0.1623 | 0.1600 | 0.1543 | ||||||||||
| (7.5664) | (13.0498) | (12.2982) | (5.3835) | (7.8725) | (8.8742) | ||||||||||
| 0.0000 | 0.0000 | 0.0000 | 0.0001 | 0.0000 | 0.0000 | 0.0000 | 0.0000 | 0.0000 | |||||||
| (1.2917) | (1.2371) | (0.5601) | (4.7611) | (3.7361) | (1.5766) | (2.2217) | (2.3581) | (1.2465) | |||||||
| -0.0000 | -0.0000 | -0.0000 | -0.0001 | -0.0000 | -0.0000 | -0.0000 | -0.0000 | -0.0000 | |||||||
| (-1.2144) | (-1.3253) | (-2.7100) | (-3.2754) | (-2.6284) | (-3.0625) | (-2.3008) | (-2.6519) | (-3.8601) | |||||||
| -0.0000 | -0.0000 | 0.0000 | 0.0000 | 0.0000 | 0.0000 | 0.0000 | 0.0000 | 0.0000 | |||||||
| (-0.3299) | (-0.8672) | (0.7395) | (1.8109) | (1.8434) | (2.8658) | (0.2245) | (0.2193) | (1.4829) | |||||||
| 0.0006 | 0.0004 | 0.0003 | 0.0005 | 0.0004 | 0.0003 | ||||||||||
| (16.1214) | (16.5137) | (12.6899) | (12.4428) | (14.1834) | (11.9258) | ||||||||||
| -0.0005 | -0.0003 | -0.0002 | -0.0004 | -0.0003 | -0.0002 | ||||||||||
| (-11.6082) | (-9.9204) | (-6.7699) | (-8.9154) | (-8.4847) | (-6.7614) | ||||||||||
| 0.0000 | -0.0000 | -0.0001 | 0.0000 | -0.0000 | -0.0001 | ||||||||||
| (1.6767) | (-1.6169) | (-4.3002) | (0.2314) | (-2.6681) | (-4.6811) | ||||||||||
| 0.0151 | 0.0071 | 0.0020 | 0.0056 | 0.0044 | 0.0022 | ||||||||||
| (13.9102) | (9.7267) | (3.2656) | (3.8549) | (4.4793) | (2.6889) | ||||||||||
| -0.0149 | -0.0080 | -0.0034 | -0.0093 | -0.0082 | -0.0061 | ||||||||||
| (-11.9530) | (-9.5473) | (-4.8554) | (-5.7842) | (-7.5661) | (-6.6299) | ||||||||||
| 0.0066 | 0.0062 | 0.0047 | 0.0042 | 0.0049 | 0.0040 | ||||||||||
| (13.2639) | (18.4812) | (16.5241) | (8.2981) | (14.3489) | (13.8061) | ||||||||||
| 0.0202 | 0.0301 | 0.0478 | 0.0091 | 0.0204 | 0.0412 | 0.0184 | 0.0273 | 0.0469 | |||||||
| (7.7037) | (16.9986) | (31.8340) | (3.4123) | (11.3901) | (27.2933) | (6.4147) | (14.1187) | (28.6104) | |||||||
Table 4
In-sample predictive R2"
| 预测周期 | 日度RV | |||||
|---|---|---|---|---|---|---|
| 特征集 | 1 | 2 | 3 | 4 | 5 | 6 |
| HAR | 0.3831 | 0.3974 | 0.3826 | 0.3975 | 0.3835 | 0.3989 |
| LASSO | 0.3831 | 0.3974 | 0.3826 | 0.3975 | 0.3835 | 0.3988 |
| PCR | 0.3815 | 0.3970 | 0.3826 | 0.3970 | 0.3835 | 0.3989 |
| KNN | 0.4318 | 0.4393 | 0.4263 | 0.4373 | 0.4334 | 0.4469 |
| RF | 0.4106 | 0.4738 | 0.4952 | 0.4598 | 0.4607 | 0.5049 |
| GBRT | 0.3438 | 0.3404 | 0.3260 | 0.3446 | 0.3258 | 0.3327 |
| TCN | 0.3943 | 0.4201 | 0.3910 | 0.4172 | 0.3992 | 0.4236 |
| SVR | 0.3417 | 0.3526 | 0.3452 | 0.3524 | 0.3463 | 0.3537 |
| NN | 0.3942 | 0.3995 | 0.3839 | 0.4048 | 0.3899 | 0.4167 |
| LSTM | 0.4065 | 0.4232 | 0.4002 | 0.4437 | 0.4368 | 0.4647 |
| Transformer | 0.3653 | 0.3945 | 0.3844 | 0.4009 | 0.4016 | 0.4183 |
| 预测周期 | 周度 | |||||
| 特征集 | 1 | 2 | 3 | 4 | 5 | 6 |
| HAR | 0.5037 | 0.5330 | 0.5266 | 0.5331 | 0.5281 | 0.5353 |
| LASSO | 0.5037 | 0.5330 | 0.5266 | 0.5330 | 0.5281 | 0.5352 |
| PCR | 0.5033 | 0.5330 | 0.5266 | 0.5331 | 0.5272 | 0.5345 |
| KNN | 0.5599 | 0.5787 | 0.5847 | 0.5899 | 0.6315 | 0.6241 |
| RF | 0.5460 | 0.5884 | 0.6012 | 0.5812 | 0.6199 | 0.6470 |
| GBRT | 0.4554 | 0.4569 | 0.4475 | 0.4620 | 0.4496 | 0.4479 |
| TCN | 0.5331 | 0.5526 | 0.5275 | 0.5451 | 0.5644 | 0.5762 |
| SVR | 0.4495 | 0.4679 | 0.4647 | 0.4684 | 0.4650 | 0.4697 |
| NN | 0.5312 | 0.5430 | 0.5386 | 0.5427 | 0.5335 | 0.5436 |
| LSTM | 0.5373 | 0.5607 | 0.5518 | 0.5757 | 0.5997 | 0.6070 |
| Transformer | 0.4950 | 0.5419 | 0.5306 | 0.5411 | 0.5472 | 0.5534 |
| 预测周期 | 月度 | |||||
| 特征集 | 1 | 2 | 3 | 4 | 5 | 6 |
| HAR | 0.5169 | 0.5526 | 0.5518 | 0.5528 | 0.5531 | 0.5550 |
| LASSO | 0.5168 | 0.5526 | 0.5517 | 0.5523 | 0.5520 | 0.5535 |
| PCR | 0.5169 | 0.5525 | 0.5517 | 0.5526 | 0.5525 | 0.5540 |
| KNN | 0.5834 | 0.6107 | 0.6319 | 0.6319 | 0.7058 | 0.6920 |
| RF | 0.5740 | 0.6095 | 0.6152 | 0.5937 | 0.6582 | 0.6539 |
| GBRT | 0.4731 | 0.4800 | 0.4803 | 0.4872 | 0.4796 | 0.4743 |
| TCN | 0.5576 | 0.5755 | 0.5899 | 0.5941 | 0.6492 | 0.6482 |
| SVR | 0.4420 | 0.4693 | 0.4704 | 0.4713 | 0.4709 | 0.4713 |
| NN | 0.5357 | 0.5705 | 0.5632 | 0.5721 | 0.5743 | 0.5752 |
| LSTM | 0.5591 | 0.5881 | 0.5960 | 0.6113 | 0.6598 | 0.6663 |
| Transformer | 0.5036 | 0.5711 | 0.5718 | 0.5760 | 0.6144 | 0.6787 |
Table 5
In-sample predictive diebold-mariano test[22] p-values"
| 预测周期 | 日度RV | |||||
|---|---|---|---|---|---|---|
| 特征集 | 1 | 2 | 3 | 4 | 5 | 6 |
| HAR | 0.0001 | 0.5189 | 0.0001 | 0.4861 | 0.0000 | |
| LASSO | 0.4462 | 0.0001 | 0.5181 | 0.0002 | 0.4844 | 0.0000 |
| PCR | 0.7517 | 0.0004 | 0.5189 | 0.0005 | 0.4861 | 0.0000 |
| KNN | 0.0000 | 0.0000 | 0.0000 | 0.0000 | 0.0000 | 0.0000 |
| RF | 0.0000 | 0.0000 | 0.0000 | 0.0000 | 0.0000 | 0.0000 |
| GBRT | 1.0000 | 1.0000 | 1.0000 | 1.0000 | 1.0000 | 1.0000 |
| TCN | 0.0262 | 0.0000 | 0.1074 | 0.0002 | 0.0024 | 0.0040 |
| SVR | 1.0000 | 0.9986 | 0.9994 | 0.9984 | 0.9992 | 0.9980 |
| NN | 0.0001 | 0.0039 | 0.4669 | 0.0000 | 0.1851 | 0.0007 |
| LSTM | 0.0001 | 0.0000 | 0.0023 | 0.0000 | 0.0000 | 0.0000 |
| Transformer | 1.0000 | 0.0090 | 0.4505 | 0.0000 | 0.0099 | 0.0115 |
| 预测周期 | 周度 | |||||
| 特征集 | 1 | 2 | 3 | 4 | 5 | 6 |
| HAR | 0.0000 | 0.0000 | 0.0000 | 0.0000 | 0.0000 | |
| LASSO | 0.4195 | 0.0000 | 0.0000 | 0.0000 | 0.0000 | 0.0000 |
| PCR | 0.7605 | 0.0000 | 0.0000 | 0.0000 | 0.0000 | 0.0000 |
| KNN | 0.0000 | 0.0000 | 0.0000 | 0.0000 | 0.0000 | 0.0000 |
| RF | 0.0000 | 0.0000 | 0.0000 | 0.0000 | 0.0000 | 0.0000 |
| GBRT | 1.0000 | 1.0000 | 1.0000 | 1.0000 | 1.0000 | 1.0000 |
| TCN | 0.0000 | 0.0000 | 0.0000 | 0.0000 | 0.0000 | 0.0000 |
| SVR | 1.0000 | 1.0000 | 1.0000 | 1.0000 | 1.0000 | 1.0000 |
| NN | 0.0000 | 0.0000 | 0.0000 | 0.0000 | 0.0000 | 0.0000 |
| LSTM | 0.0000 | 0.0000 | 0.0000 | 0.0000 | 0.0000 | 0.0000 |
| Transformer | 0.9989 | 0.0000 | 0.0000 | 0.0000 | 0.0000 | 0.0000 |
| 预测周期 | 月度 | |||||
| 特征集 | 1 | 2 | 3 | 4 | 5 | 6 |
| HAR | 0.0000 | 0.0000 | 0.0000 | 0.0000 | 0.0000 | |
| LASSO | 0.5838 | 0.0000 | 0.0000 | 0.0000 | 0.0000 | 0.0000 |
| PCR | 0.7624 | 0.0000 | 0.0000 | 0.0000 | 0.0000 | 0.0000 |
| KNN | 0.0000 | 0.0000 | 0.0000 | 0.0000 | 0.0000 | 0.0000 |
| RF | 0.0000 | 0.0000 | 0.0000 | 0.0000 | 0.0000 | 0.0000 |
| GBRT | 1.0000 | 1.0000 | 1.0000 | 1.0000 | 1.0000 | 1.0000 |
| TCN | 0.0000 | 0.0000 | 0.0000 | 0.0000 | 0.0000 | 0.0000 |
| SVR | 1.0000 | 1.0000 | 1.0000 | 1.0000 | 1.0000 | 1.0000 |
| NN | 0.0000 | 0.0000 | 0.0000 | 0.0000 | 0.0000 | 0.0000 |
| LSTM | 0.0000 | 0.0000 | 0.0000 | 0.0000 | 0.0000 | 0.0000 |
| Transformer | 1.0000 | 0.0000 | 0.0000 | 0.0000 | 0.0000 | 0.0000 |
Table 6
Out-of-sample predictive R o o s 2"
| 预测周期 | 日度 | |||||
|---|---|---|---|---|---|---|
| 特征集 | 1 | 2 | 3 | 4 | 5 | 6 |
| HAR | 0.3128 | 0.3028 | 0.2620 | 0.3012 | 0.2605 | 0.3009 |
| LASSO | 0.2754 | 0.2515 | 0.2469 | 0.2505 | 0.2469 | 0.2505 |
| PCR | 0.2947 | 0.2834 | 0.2474 | 0.2825 | 0.2463 | 0.2754 |
| KNN | 0.2767 | 0.2523 | 0.2443 | 0.2485 | 0.2272 | 0.2535 |
| RF | 0.2797 | 0.2741 | 0.2446 | 0.2709 | 0.2316 | 0.2573 |
| GBRT | 0.2366 | 0.2350 | 0.2208 | 0.2380 | 0.2199 | 0.2265 |
| TCN | 0.3125 | 0.2809 | 0.2560 | 0.2786 | 0.2408 | 0.2892 |
| SVR | 0.2599 | 0.2423 | 0.2316 | 0.2418 | 0.2332 | 0.2434 |
| NN | 0.3069 | 0.2917 | 0.2554 | 0.2864 | 0.2630 | 0.3091 |
| LSTM | 0.3056 | 0.2998 | 0.2644 | 0.2681 | 0.2375 | 0.2450 |
| Transformer | 0.3022 | 0.2767 | 0.2439 | 0.2947 | 0.2273 | 0.2707 |
| 预测周期 | 周度 | |||||
| 特征集 | 1 | 2 | 3 | 4 | 5 | 6 |
| HAR | 0.2714 | 0.3086 | 0.2930 | 0.3094 | 0.2851 | 0.2997 |
| LASSO | 0.2556 | 0.2765 | 0.2786 | 0.2788 | 0.2786 | 0.2771 |
| PCR | 0.2472 | 0.2735 | 0.2602 | 0.2771 | 0.2532 | 0.2668 |
| KNN | 0.2640 | 0.2461 | 0.2538 | 0.2480 | 0.2207 | 0.2307 |
| RF | 0.2930 | 0.2880 | 0.2717 | 0.2855 | 0.2396 | 0.2557 |
| GBRT | 0.2633 | 0.2687 | 0.2609 | 0.2756 | 0.2595 | 0.2597 |
| TCN | 0.3048 | 0.3072 | 0.2912 | 0.2789 | 0.2605 | 0.2647 |
| SVR | 0.2359 | 0.2403 | 0.2331 | 0.2414 | 0.2334 | 0.2408 |
| NN | 0.3175 | 0.3023 | 0.2982 | 0.2992 | 0.2913 | 0.2898 |
| LSTM | 0.3069 | 0.2589 | 0.2488 | 0.2455 | 0.2039 | 0.1459 |
| Transformer | 0.2443 | 0.2768 | 0.2642 | 0.2845 | 0.2514 | 0.2754 |
| 预测周期 | 月度RV | |||||
| 特征集 | 1 | 2 | 3 | 4 | 5 | 6 |
| HAR | 0.2098 | 0.3014 | 0.2934 | 0.3015 | 0.2668 | 0.2698 |
| LASSO | 0.1930 | 0.2672 | 0.2700 | 0.2719 | 0.2700 | 0.2533 |
| PCR | 0.1487 | 0.2255 | 0.2236 | 0.2320 | 0.2052 | 0.2066 |
| KNN | 0.2069 | 0.1990 | 0.2130 | 0.1858 | 0.1262 | 0.1433 |
| RF | 0.2669 | 0.2789 | 0.2580 | 0.2822 | 0.2370 | 0.2506 |
| GBRT | 0.2745 | 0.2812 | 0.2798 | 0.2914 | 0.2775 | 0.2729 |
| TCN | 0.2990 | 0.2560 | 0.2851 | 0.2233 | 0.1912 | 0.2536 |
| SVR | 0.1550 | 0.1949 | 0.1925 | 0.1993 | 0.1884 | 0.1903 |
| NN | 0.2119 | 0.2556 | 0.2373 | 0.2747 | 0.2657 | 0.2569 |
| LSTM | 0.3076 | 0.2759 | 0.2654 | 0.2039 | 0.1172 | 0.1593 |
| Transformer | 0.2062 | 0.2582 | 0.2109 | 0.2335 | 0.0569 | 0.1486 |
Table 7
Out-of-sample predictive diebold-mariano test [22] p-values"
| 预测周期 | 日度RV | |||||
|---|---|---|---|---|---|---|
| 特征集 | 1 | 2 | 3 | 4 | 5 | 6 |
| HAR | 0.7153 | 0.9061 | 0.7317 | 0.9166 | 0.7463 | |
| LASSO | 0.9941 | 0.9582 | 0.9577 | 0.9558 | 0.9576 | 0.9558 |
| PCR | 1.0000 | 0.9588 | 0.9699 | 0.9519 | 0.9746 | 0.9711 |
| KNN | 0.9968 | 0.9973 | 0.9927 | 0.9924 | 0.9956 | 0.9914 |
| RF | 0.9396 | 0.9740 | 0.9763 | 0.9595 | 0.9906 | 0.9807 |
| GBRT | 0.9843 | 0.9811 | 0.9843 | 0.9758 | 0.9846 | 0.9841 |
| TCN | 0.5088 | 0.9440 | 0.9624 | 0.9690 | 0.9901 | 0.8832 |
| SVR | 0.9953 | 0.9796 | 0.9812 | 0.9790 | 0.9801 | 0.9779 |
| NN | 0.6673 | 0.8200 | 0.9608 | 0.9407 | 0.9250 | 0.5955 |
| LSTM | 0.6684 | 0.8122 | 0.9449 | 0.9953 | 0.9928 | 0.9998 |
| Transformer | 0.9970 | 0.9888 | 0.9866 | 0.8265 | 0.9970 | 0.9152 |
| 预测周期 | 周度RV | |||||
| 特征集 | 1 | 2 | 3 | 4 | 5 | 6 |
| HAR | 0.0030 | 0.1587 | 0.0038 | 0.2460 | 0.0164 | |
| LASSO | 0.9045 | 0.4049 | 0.3704 | 0.3660 | 0.3704 | 0.3844 |
| PCR | 0.9997 | 0.4322 | 0.7280 | 0.3282 | 0.8548 | 0.6413 |
| KNN | 0.6793 | 0.9384 | 0.8350 | 0.9379 | 0.9981 | 0.9991 |
| RF | 0.1037 | 0.1616 | 0.4932 | 0.1972 | 0.9606 | 0.8565 |
| GBRT | 0.6361 | 0.5447 | 0.6564 | 0.4306 | 0.6784 | 0.6819 |
| TCN | 0.0270 | 0.0118 | 0.1344 | 0.2906 | 0.7380 | 0.6721 |
| SVR | 0.9861 | 0.9264 | 0.9542 | 0.9177 | 0.9560 | 0.9255 |
| NN | 0.0018 | 0.0016 | 0.0805 | 0.0304 | 0.1227 | 0.1213 |
| LSTM | 0.0077 | 0.8341 | 0.9393 | 0.9579 | 1.0000 | 1.0000 |
| Transformer | 0.9998 | 0.3099 | 0.6649 | 0.1935 | 0.9126 | 0.3577 |
| 预测周期 | 月度RV | |||||
| 特征集 | 1 | 2 | 3 | 4 | 5 | 6 |
| HAR | 0.0000 | 0.0000 | 0.0000 | 0.0007 | 0.0001 | |
| LASSO | 0.8790 | 0.0026 | 0.0019 | 0.0012 | 0.0019 | 0.0117 |
| PCR | 1.0000 | 0.1461 | 0.2286 | 0.0644 | 0.6082 | 0.5840 |
| KNN | 0.5693 | 0.7063 | 0.4352 | 0.9145 | 1.0000 | 1.0000 |
| RF | 0.0012 | 0.0003 | 0.0115 | 0.0001 | 0.0844 | 0.0212 |
| GBRT | 0.0097 | 0.0056 | 0.0061 | 0.0016 | 0.0058 | 0.0110 |
| TCN | 0.0000 | 0.0089 | 0.0002 | 0.2714 | 0.7970 | 0.0209 |
| SVR | 0.9937 | 0.7117 | 0.7390 | 0.6534 | 0.7924 | 0.7705 |
| NN | 0.4388 | 0.0074 | 0.0897 | 0.0002 | 0.0040 | 0.0050 |
| LSTM | 0.0000 | 0.0004 | 0.0047 | 0.6551 | 0.9998 | 0.9739 |
| Transformer | 0.6040 | 0.0029 | 0.4732 | 0.1100 | 1.0000 | 0.9910 |
| [1] |
CORSI F. A simple approximate long-memory model of realized volatility[J]. Journal of Financial Econometrics, 2009, 7(2): 174-196.
doi: 10.1093/jjfinec/nbp001 |
| [2] |
ANDERSEN T G, BOLLERSLEV T, DIEBOLD F X. Roughing it up: Including jump components in the measurement, modeling, and forecasting of return volatility[J]. The Review of Economics and Statistics, 2007, 89(4): 701-720.
doi: 10.1162/rest.89.4.701 |
| [3] |
BOLLERSLEV T, TODOROV V, LI S Z. Jump tails, extreme dependencies, and the distribution of stock returns[J]. Journal of Econometrics, 2013, 172(2): 307-324.
doi: 10.1016/j.jeconom.2012.08.014 |
| [4] |
CAPORIN M. The role of jumps in realized volatility modeling and forecasting[J]. Journal of Financial Econometrics, 2023, 21(4): 1143-1168.
doi: 10.1093/jjfinec/nbab030 |
| [5] |
MERTON R C. Option pricing when underlying stock returns are discontinuous[J]. Journal of Financial Economics, 1976, 3(1-2): 125-144.
doi: 10.1016/0304-405X(76)90022-2 |
| [6] | AIT-SAHALIA Y, CACHO-DIAZ J, HURD T R. Portfolio choice with jumps: a closed-form solution[J]. The Annals of Applied Probability, 2009, 19(2): 556-584. |
| [7] |
AÏT-SAHALIA Y, CACHO-DIAZ J, LAEVEN R J A. Modeling financial contagion using mutually exciting jump processes[J]. Journal of Financial Economics, 2015, 117(3): 585-606.
doi: 10.1016/j.jfineco.2015.03.002 |
| [8] |
MAHEU J M, MCCURDY T H. News arrival, jump dynamics, and volatility components for individual stock returns[J]. The Journal of Finance, 2004, 59(2): 755-793.
doi: 10.1111/jofi.2004.59.issue-2 |
| [9] |
GU S, KELLY B, XIU D. Empirical asset pricing via machine learning[J]. The Review of Financial Studies, 2020, 33(5): 2223-2273.
doi: 10.1093/rfs/hhaa009 |
| [10] |
JIANG J, KELLY B, XIU D. (Re-) Imag (in) ing price trends[J]. The Journal of Finance, 2023, 78(6): 3193-3249.
doi: 10.1111/jofi.v78.6 |
| [11] |
CHEN L, PELGER M, ZHU J. Deep learning in asset pricing[J]. Management Science, 2024, 70(2): 714-750.
doi: 10.1287/mnsc.2023.4695 |
| [12] |
BUCCI A. Realized volatility forecasting with neural networks[J]. Journal of Financial Econometrics, 2020, 18(3): 502-531.
doi: 10.1093/jjfinec/nbaa008 |
| [13] |
ZHU H, BAI L, HE L, et al. Forecasting realized volatility with machine learning: Panel data perspective[J]. Journal of Empirical Finance, 2023, 73: 251-271.
doi: 10.1016/j.jempfin.2023.07.003 |
| [14] |
CHRISTENSEN K, SIGGAARD M, VELIYEV B. A machine learning approach to volatility forecasting[J]. Journal of Financial Econometrics, 2023, 21(5): 1680-1727.
doi: 10.1093/jjfinec/nbac020 |
| [15] |
LI S Z, TANG Y. Automated volatility forecasting[J]. Management Science, 2025, 71(7): 6248-6274.
doi: 10.1287/mnsc.2023.01520 |
| [16] |
ZHANG Y, SONG Y, PENG Y, et al. Volatility forecasting incorporating intraday positive and negative jumps based on deep learning model[J]. Journal of Forecasting, 2024, 43(7): 2749-2765.
doi: 10.1002/for.v43.7 |
| [17] |
ANDERSEN T G, BOLLERSLEV T, DIEBOLD F X, et al. The distribution of realized stock return volatility[J]. Journal of Financial Economics, 2001, 61(1): 43-76.
doi: 10.1016/S0304-405X(01)00055-1 |
| [18] |
BARNDORFF-NIELSEN O E, SHEPHARD N. Power and bipower variation with stochastic volatility and jumps[J]. Journal of Financial Econometrics, 2004, 2(1): 1-37.
doi: 10.1093/jjfinec/nbh001 |
| [19] | SILVERMAN B W. Density estimation for statistics and data analysis[M]. New York: Routledge, 2018. |
| [20] |
DING Z, GRANGER C W J, ENGLE R F. A long memory property of stock market returns and a new model[J]. Journal of Empirical Finance, 1993, 1(1): 83-106.
doi: 10.1016/0927-5398(93)90006-D |
| [21] |
TIBSHIRANI R. Regression shrinkage and selection via the lasso[J]. Journal of the Royal Statistical Society Series B: Statistical Methodology, 1996, 58(1): 267-288.
doi: 10.1111/j.2517-6161.1996.tb02080.x |
| [22] |
DIEBOLD F X, MARIANO R S. Comparing predictive accuracy[J]. Journal of Business & Economic Statistics, 2002, 20(1): 134-144.
doi: 10.1198/073500102753410444 |
| [23] |
LIU L Y, PATTON A J, SHEPPARD K. Does anything beat 5-minute RV? A comparison of realized measures across multiple asset classes[J]. Journal of Econometrics, 2015, 187(1): 293-311.
doi: 10.1016/j.jeconom.2015.02.008 |
| [24] |
Bollerslev T, Patton A J, Quaedvlieg R. Exploiting the errors: A simple approach for improved volatility forecasting[J]. Journal of Econometrics, 2016, 192(1): 1-18.
doi: 10.1016/j.jeconom.2015.10.007 |
| [25] |
BOLLERSLEV T, MEDEIROS M C, PATTON A J, et al. From zero to hero: Realized partial (co) variances[J]. Journal of Econometrics, 2022, 231(2): 348-360.
doi: 10.1016/j.jeconom.2021.04.013 |
| [26] |
ENGLE R F, SOKALSKA M E. Forecasting intraday volatility in the US equity market. Multiplicative component GARCH[J]. Journal of Financial Econometrics, 2012, 10(1): 54-83.
doi: 10.1093/jjfinec/nbr005 |
| [27] |
BOLLERSLEV T, HOOD B, HUSS J, et al. Risk everywhere: Modeling and managing volatility[J]. The Review of Financial Studies, 2018, 31(7): 2729-2773.
doi: 10.1093/rfs/hhy041 |
| [1] | CAI Yi,WANG Xiaobin,CHEN Ruili,HAN Xun. Review of Research on Gender and Age Detection of Writers Based on Handwriting [J]. Frontiers of Data and Computing, 2026, 8(1): 129-147. |
| [2] | JI Peng,NIU Tie,WEI Ting,PENG Liang. Research on Supercomputer Job Running State Prediction Based on XGBoost Model [J]. Frontiers of Data and Computing, 2024, 6(6): 123-129. |
| [3] | ZHANG Bin,LI Chen,LU Zhonghua. A Survey of Research on Risk Factors in the Chinese Stock Market [J]. Frontiers of Data and Computing, 2024, 6(6): 146-159. |
| [4] | LONG Chun, LI Lisha, LI Jing, YANG Fan, WEI Jinxia, Fu Yuhao. Review of Research on Secure Inference in Machine Learning [J]. Frontiers of Data and Computing, 2024, 6(5): 1-12. |
| [5] | CHEN Yubin, HONG Ye, CUI Wenjuan, HUANG Minyi, ZHANG Jinyu. A Study on Multidimensional Data-Driven Commodity Demand Forecasting [J]. Frontiers of Data and Computing, 2024, 6(5): 169-177. |
| [6] | GUO Xuebing, ZHU Xiaojie, TANG Xinzhai, YANG Gang, HOU Yanfei, HE Honglin. Study on Integration Method of Algorithm Model Based on Big Data Pipeline— Taking Tree Biomass Inversion Based on Machine Learning Method and LiDAR Data as an Example [J]. Frontiers of Data and Computing, 2024, 6(4): 96-105. |
| [7] | HE Ruilin, YANG Xinyi, SUN Hongzan, LI Chen. The Latest Development and Prospects of Histopathological Image Analysis Methods Based on Graph Features [J]. Frontiers of Data and Computing, 2024, 6(2): 101-116. |
| [8] | YE Xu, DU Yi, CUI Wenjuan, SHEN Junjie, XIE Jing, WANG Ludi. Application of Machine Learning Technology in the Field of Eye Health [J]. Frontiers of Data and Computing, 2024, 6(2): 117-133. |
| [9] | LI Weizhao, WANG Wei. A Fast SVD Algorithm Based on Domestic Heterogeneous Computing Platform and Its Application in Ocean Data Assimilation [J]. Frontiers of Data and Computing, 2024, 6(1): 35-45. |
| [10] | SHEN Zhihao, LI Na, YIN Shihao, DU Yi, HU Lianglin. Airfare Price Prediction Based on TPA-Transformer [J]. Frontiers of Data and Computing, 2023, 5(6): 115-125. |
| [11] | WEI Ting, PENG Liang, NIU Tie, ZHANG Honghai. Detection and Root Cause Analysis of HPC Failure Jobs Based on Feature Analysis [J]. Frontiers of Data and Computing, 2023, 5(6): 94-103. |
| [12] | SUN Yifan, ZHANG Rui, TAO Yang, GAO Birou, QIN Shihan, AN Chao. A Survey on Local Differential Privacy [J]. Frontiers of Data and Computing, 2023, 5(5): 74-97. |
| [13] | TIAN Yiqing, CHENG Xi, FENG Bojing. A Review of Computational Models for Corporate Credit Rating [J]. Frontiers of Data and Computing, 2023, 5(4): 139-153. |
| [14] | CHEN Meilin, LIU Duanyang, XU Liming, WANG Yang. A Review of Force Field Models Based on Machine Learning [J]. Frontiers of Data and Computing, 2023, 5(4): 27-37. |
| [15] | LIU Duanyang, WEI Zhongming. Application of Supervised Learning Algorithms in Materials Science [J]. Frontiers of Data and Computing, 2023, 5(4): 38-47. |
| Viewed | ||||||
|
Full text |
|
|||||
|
Abstract |
|
|||||